
GPU TESTER
Professional browser performance testing with real-time analytics and advanced monitoring
Performance Results
Interactive 2D Stress Zone
GPU Performance Graph
Network Speed Test
System Temperature Monitor
System thermal analysis will appear here.
Status: Ready
Introduction: Why GPU Performance Testing Matters

GPU performance has never been more critical — and never more difficult to measure accurately.
From 4K gaming to AI inference, modern applications are pushing GPUs beyond traditional benchmarks. Gamers demand ultra-high framerates. Developers render complex 3D scenes. PC builders fine-tune thermal performance. AI researchers need GPU stability under extreme load. Even casual users rely on GPUs for video editing, browser acceleration, and remote workloads.
Yet most legacy performance tools weren’t designed for this. UserBenchmark, once considered a staple, lacks stress testing, offers no real-time metrics, and produces skewed scores. FurMark simulates load but provides minimal context beyond raw heat and power. These older tools:
- Require installation and elevated permissions
- Often lock users into specific platforms (usually Windows)
- Offer static results, not dynamic insights
- Do not support PDF export or cross-device diagnostics
Table of Contents
Why Modern Workflows Require Modern Tools
Today’s workloads are diverse, real-time, and cross-platform. That’s why a new breed of performance tools is emerging — browser-based GPU testers that deliver:
- Real-time metrics on FPS, GPU load, VRAM, and more
- Stress simulation zones to evaluate thermal and power thresholds
- Interactive graphs to visualize performance under load
- Instant PDF exports for diagnostics or QA
- Compatibility across all major browsers and operating systems — no installation required
Our own GPU testing platform is part of this shift. Built to empower:
- Gamers diagnosing frame drops or stutters
- Developers analyzing load and clock behavior
- AI researchers testing compute throughput stability
- PC builders and QA teams validating thermal design and system readiness
In the sections ahead, you’ll learn how to evaluate GPU performance intelligently — using live metrics, stress zones, and shareable reports.
Core Metrics Explained: Real-Time Monitoring in Modern Tools
Performance isn’t just about one number. It’s about understanding how multiple system components behave together — in real time. Here are the most important GPU metrics you should monitor, with practical examples and use cases.
Table: Key Real-Time GPU Metrics
| Metric | What It Shows | Why It Matters |
|---|---|---|
| FPS (Frames/sec) | Number of frames rendered per second | Higher = smoother performance in games or previews |
| Frame Time | Time taken to render one frame (ms) | Reveals stutter, lag, and pacing issues |
| Latency | Input-to-output response delay | Impacts usability in fast-paced apps or gaming |
| GPU Utilization (%) | Current workload on the GPU | Indicates underuse or saturation |
| Clock Speeds | GPU core and memory frequency (MHz) | Shows throttling or boost behavior under load |
| VRAM Usage | Amount of video memory in use (MB/GB) | Detects memory limits and paging |
| Temperature (°C) | GPU thermal state | Thermal throttling leads to slowdowns |
| Power Draw (W) | Energy consumed by GPU | Important for laptops, undervolting, PSU matching |
| CPU/RAM/Network | Companion metrics for context | Diagnoses bottlenecks outside GPU |
Let’s explore each in more detail.
1. FPS: Frames Per Second
FPS is the most well-known GPU performance indicator. It represents how many frames your system renders per second — a key signal of smoothness and responsiveness.
- 60+ FPS is considered optimal for most games
- 120–240 FPS is ideal for competitive or high-refresh monitors
But FPS alone doesn’t tell the full story. Spikes, dips, and frame inconsistency can still occur even at high framerates.
Example:
If your system averages 90 FPS but frequently dips to 40, you’ll notice stuttering — especially in fast-paced games or VR.
2. Frame Time and Latency
Frame time measures how long (in milliseconds) it takes to render a single frame. Consistent frame times make a system feel smooth. Variance causes perceived stutter, even at high FPS.
Latency, on the other hand, measures the delay between user input (mouse click) and visual response. Low latency is essential for competitive play and real-time creative workflows.
| Frame Rate | Ideal Frame Time |
|---|---|
| 60 FPS | 16.67 ms |
| 120 FPS | 8.33 ms |
| 240 FPS | 4.17 ms |
Use-case:
If you’re streaming or gaming at 144Hz but experiencing microstutters, checking frame time variance will pinpoint the source.
3. GPU Utilization (% Load)
This metric reveals how hard the GPU is working.
- 99–100% usage suggests the GPU is the current performance limit
- 50–60% usage during heavy tasks might indicate a CPU bottleneck or power constraint
- Sudden drops in usage may signal thermal throttling or driver instability
Diagnostic Tip:
If your GPU load drops when launching a specific game, but CPU usage spikes, it’s likely your CPU or RAM is the limiting factor — not your graphics card.
4. Clock Speeds (Core & Memory)
Modern GPUs use dynamic frequency scaling — boosting clock speeds when needed, reducing them under low load or thermal pressure.
- Core Clock affects raw rendering and shading throughput
- Memory Clock determines how quickly VRAM is accessed
Monitoring these live tells you whether your system is boosting properly or throttling under sustained load.
Example:
During a 3D rendering job, if clock speeds slowly fall from 1800MHz to 1200MHz, thermal constraints or power limits may be reducing performance.
5. VRAM Usage
VRAM is essential for storing high-resolution textures, frame buffers, and neural model parameters (for AI workloads).
When you exceed available VRAM, your system offloads to system RAM, causing performance crashes or severe FPS dips.
| Task/Resolution | VRAM Needed |
|---|---|
| 1080p gaming | 4–6 GB |
| 4K textures | 8–12 GB |
| AI inference models | 6–10 GB |
Use-case:
When using your browser-based testing tool during a stable diffusion task, you can see VRAM hit 90% within seconds — an early sign to close background apps.
6. Temperature and Thermal Throttling
Keeping track of GPU temperature ensures your card isn’t silently losing performance due to heat.
- Idle temp: 35–50°C
- Typical gaming load: 65–85°C
- Throttling risk: 90°C+
Thermal throttling causes clock speed reductions and reduced FPS. A real-time testing tool helps visualize this — especially under sustained load.
Tip:
Use the tool’s stress mode and graph thermal rise over 15 minutes. A clear plateau followed by performance drop? That’s throttling.
7. Power Draw (Watts)
Especially important on laptops and compact PCs, power draw helps users:
- Determine power efficiency
- Test undervolting or boost settings
- Diagnose insufficient PSUs or unstable power delivery
Example:
A laptop pulling 65W at peak load may throttle early compared to one that can sustain 100W+.
8. CPU, RAM, and Network Context
A GPU tool is even more powerful when paired with contextual monitoring:
| Resource | Why It Matters |
|---|---|
| CPU | Helps identify CPU-bound scenarios or scheduling issues |
| RAM | Indicates if paging or memory leaks are impacting performance |
| Network | Monitors latency and throughput for cloud or multiplayer workloads |
Use-case:
During a remote desktop AI session, network packet drops may cause a perceived GPU issue. Real-time network stats clarify what’s really happening.
Why Real-Time Beats Synthetic Benchmarks
Legacy tools give you a score. But performance isn’t one number — it’s an evolving graph of interactions.
| Legacy Tools | Modern Real-Time Tools |
|---|---|
| Static snapshot (score) | Continuous monitoring with context |
| No stress or thermal data | Full thermal/load simulation |
| Windows-only | Cross-platform via browser |
| No visual insights | Interactive graphs, historical trends |
| No export/reporting | PDF output with system info + visual graphs |
Real-time testing shows you:
- When performance drops occur
- Why they happen (heat, load, VRAM, CPU, etc.)
- How your system behaves under real, changing workloads
This makes it actionable — for optimization, diagnosis, or tuning.
Stress Testing: What Is a Stress Zone and Why Does It Matter?
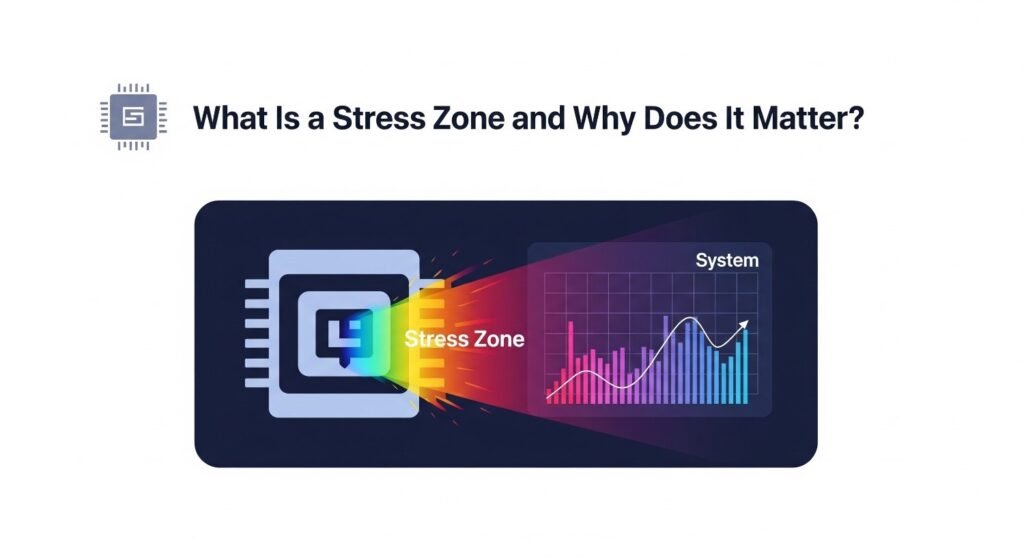
Traditional benchmarks provide surface-level insight. But to truly understand how a GPU behaves under sustained workloads — especially in unpredictable real-world scenarios — you need stress testing.
What Is GPU Stress Testing?
Stress testing deliberately puts your GPU under prolonged, high-load conditions to simulate demanding tasks. This is not just about hitting 100% usage for a few seconds — it’s about pushing the card’s:
- Thermal design
- Clock speed limits
- Power draw
- Cooling efficiency
- Stability under fluctuating workloads
Stress testing is how you reveal weak points that may not surface during short, synthetic runs.
Key Reasons to Stress Test Your GPU
| Objective | What You Learn |
|---|---|
| Thermal behavior | How quickly the GPU heats and cools under load |
| Boost and throttle behavior | When and why clock speeds change |
| Power limits | Maximum wattage draw and PSU behavior |
| Stability and crash testing | Whether the GPU can handle sustained high load |
| System design validation | Fan curve effectiveness, airflow tuning, heatsink capacity |
In essence, stress testing answers:
“Can this system maintain peak performance in actual use — not just in short bursts?”
The “Stress Zone” in Modern GPU Testing Tools
Our tool introduces a built-in Stress Zone — a one-click environment that simulates extreme real-world GPU load directly in the browser.
How It Works:
- Instantly ramps GPU utilization to 90–100%
- Sustains high load over a configurable period (e.g., 5–20 minutes)
- Displays all critical metrics (temperature, FPS, VRAM, clock speed) in real time
- Visualizes throttle points, saturation, and performance cliffs
No Installation Required
Unlike legacy tools that require installations, drivers, and OS-specific access, our Stress Zone runs entirely in-browser, making it ideal for:
- Cloud-connected testing
- Mobile or thin-client devices
- Corporate environments where installs are restricted
- Remote or distributed QA teams
Why Stress Zones Are Crucial for Modern Users
1. Gamers
High-performance gaming creates spikes in load — from shader effects to physics simulations. A GPU may appear stable at idle or during a benchmark, but crash after 10 minutes of real gameplay due to thermals or power limits.
Stress Zone Insight:
Simulate continuous 100% GPU load to mimic a high-end game session. Track temperatures, power draw, and clock speed drops.
2. Developers
Real-time rendering engines, shaders, and compiled scenes often hit performance cliffs during live previews or testing phases.
Stress Zone Insight:
Analyze how assets affect load balance and whether VRAM limits cause swap delays.
3. AI Researchers
Running large-scale models on local GPUs requires sustained compute. The card must remain stable for 20–60 minutes without crashing or throttling.
Stress Zone Insight:
Test compute limits, power draw, and throttling thresholds before beginning a long inference cycle.
4. System Builders and Testers
Thermal solution validation is a key part of any build. Stress testing helps verify:
- Fan curve programming
- Heatsink performance
- Case airflow adequacy
- GPU VRM stability
Stress Zone Insight:
Run the test across multiple form factors and cooling solutions. Compare results visually via graphs and exported reports.
Benefits of Browser-Based Stress Zones
| Feature | Benefit |
|---|---|
| No install or drivers | Works instantly on any browser or OS |
| Runs on laptops & mobiles | Unique in-device stress testing (useful for thermally constrained systems) |
| Exportable metrics | Generate shareable PDF reports for thermal logs |
| Live visual feedback | Identify throttling behavior in real time |
| Secure and private | No data uploads or cloud tracking |
Bottom line:
Stress Zones give you the truth about GPU behavior — without needing 3rd-party software, elevated permissions, or synthetic assumptions.
Interactive Graphs and Visual Analysis
Data alone isn’t enough. You need visual clarity to interpret GPU performance meaningfully. That’s where interactive graphs come in.
Our GPU testing tool includes real-time graphing and performance visualization — helping users see patterns, identify bottlenecks, and make informed decisions fast.
Why Graphs Matter in GPU Testing
Let’s break down how different visual elements enhance performance diagnostics.
| Graph Type | Reveals |
|---|---|
| FPS Timeline | Spikes, stutters, or dips during specific activities |
| Frame Time Graph | Latency issues, input lag, uneven pacing |
| Temperature Curve | Thermal buildup and dissipation trends |
| Clock Speed Chart | Boosting, throttling, and power limit impacts |
| VRAM Usage Trend | Texture scaling, AI model load, memory saturation |
| Power Draw Graph | PSU stability, undervolting effects, energy scaling |
Example: Reading an FPS and Frame Time Graph
Consider the following simulated scenario:
| Time (Seconds) | FPS | Frame Time (ms) |
|---|---|---|
| 0–10 | 144 | 6.9 |
| 10–30 | 120 | 8.3 |
| 30–45 | 80 | 12.5 |
| 45–60 | 60 | 16.6 |
Interpretation:
- The FPS decline shows performance drop over time
- Frame time increases reveal latency buildup
- A flattening pattern in temperature graph confirms thermal throttling is likely the cause
Advantages Over Static Benchmarks
| Static Tools | Interactive Graphs |
|---|---|
| Show one result | Show continuous performance under load |
| No visual context | Display patterns and anomaly clusters |
| Require manual recording | Exportable and timestamped automatically |
| Can misrepresent behavior | Reveal true GPU dynamics over time |
Graphs help users spot issues like:
- VRAM saturation during AI model previews
- Power throttling during mobile gaming sessions
- Frame pacing inconsistencies caused by driver updates
- GPU crashes triggered only under heat or sustained load
UX Matters: Graphs That Require No Expertise
Legacy tools often display data in raw or cryptic form — forcing users to interpret it without context.
Our browser-based GPU tester takes a different approach:
- Pre-labeled graphs with contextual axes (e.g., °C, FPS, Watts)
- Zoom and hover support for precision
- Split-screen layout for tracking multiple metrics simultaneously
- Toggleable overlays for simplified or advanced views
- Mobile responsive design for small screens or tablets
This makes it accessible for gamers and QA testers, not just engineers.
Exporting Graphs for Analysis or Reporting
The visual data captured during a test session isn’t locked to your browser.
- Export graphs as high-res images
- Include them in the tool’s PDF report
- Use for internal QA reviews, RMA proof, thermal analysis, or client diagnostics
Whether you’re optimizing a fan curve or proving a warranty claim, visuals add clarity and authority.
Zero-Setup Testing Across Any Device or Browser
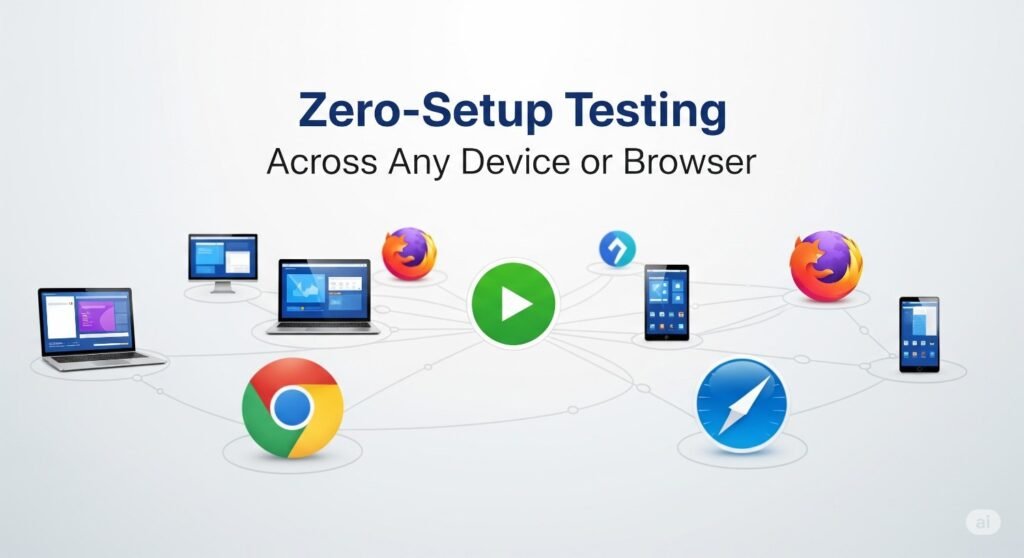
The way users interact with GPU-powered systems has evolved. No longer limited to high-end desktops, GPU-intensive workflows now span laptops, Chromebooks, mobile devices, and even virtual machines. Yet most traditional benchmarking tools remain constrained by legacy requirements — they need to be installed, are often Windows-only, and don’t support modern distributed workflows.
Limitations of Traditional GPU Testing Tools
Legacy utilities like FurMark, UserBenchmark, or MSI Afterburner come with a set of structural challenges:
- Installation Required: Many demand administrative privileges, making them unusable on shared or restricted systems.
- OS Lock-In: Most are platform-specific, primarily built for Windows environments.
- No Mobile Support: Mobile GPUs, now common in gaming and AI, are left untested.
- Enterprise Barriers: Enterprise firewalls and IT policies often block their use entirely.
- Static Workflows: They offer no browser support or remote compatibility, which are now essential.
As testing environments diversify, there’s a need for portable, no-install tools that just work — anywhere.
The Browser-Native Advantage
Our modern GPU testing tool is entirely browser-based. This means:
- No software installation
- No drivers or configuration
- Works on any OS (Windows, macOS, Linux, iOS, Android, ChromeOS)
- Launches instantly on Chrome, Firefox, Edge, Safari, and others
- Privacy-respecting — no data uploads, no tracking, fully local execution
This zero-setup design makes it ideal for:
- IT admins validating systems without software footprints
- Remote QA teams benchmarking machines from anywhere
- Developers testing GPU behavior across multiple devices
- Mobile and Chromebook users who can’t install native apps
- Gamers and enthusiasts who want fast diagnostics with no system changes
Cross-Device Compatibility at a Glance
| Device Type | Supported | Use Case Example |
|---|---|---|
| Desktop (Windows/macOS/Linux) | ✔ | Full stress testing during game or render tasks |
| Chromebook | ✔ | Classroom or enterprise GPU diagnostics |
| Android/iOS Phones | ✔ | Mobile gaming thermal and performance checks |
| Tablets/iPads | ✔ | Developer preview under load (e.g., AR apps) |
| Thin Clients / VMs | ✔ | Browser-based GPU checks in virtual environments |
No software. No sign-in. No platform bias.
PDF Report Generation: Exporting and Sharing Results
Real-time data is valuable — but being able to preserve, share, or compare that data over time is even more powerful. That’s where our built-in PDF reporting engine comes in.
With one click, users can generate a fully formatted, timestamped PDF report summarizing their entire test session.
What the Report Includes
- Date and Time of Test
- Browser and Device Info (GPU model, OS, browser version)
- Average, Max, and Min FPS
- VRAM and Clock Speed Behavior
- Thermal Curve Over Time
- Frame Time and Latency
- Stress Zone Results (Before, During, After Load)
- Power Draw Trends (if available)
- Visual Graphs for FPS, Thermals, and Utilization
All data is packaged in a clean, readable format suitable for personal records, diagnostics, or technical documentation.
Key Use Cases for Exporting GPU Performance Reports
| Use Case | How the PDF Report Helps |
|---|---|
| Technical Support | Attach visual data when submitting a ticket — no guesswork |
| Hardware Validation | Confirm thermals and load behavior before shipping or use |
| RMA / Warranty Proof | Document overheating, throttling, or crashes with evidence |
| QA and DevOps | Track GPU regressions, test cycles, or performance deltas |
| Second-Hand GPU Purchases | Request or send proof of stable performance |
| Client Deliverables | Share documented performance results in hardware reviews |
Exporting is Fast, Secure, and Offline-Friendly
- Instant Generation: No upload, no processing queue — the report is created client-side
- Secure by Design: Data never leaves your system
- Offline Capability: Once loaded, the tool can run and export even without internet access
- No Login Required: Entirely anonymous and frictionless
- PDF is Universal: Viewable on all platforms, easily attachable in emails or archives
You can think of the PDF as your performance passport — useful not just for analysis, but for accountability, resale, technical support, and historical benchmarking.
Comparison: Modern Tools vs Legacy Benchmarks
Benchmarking tools like UserBenchmark, FurMark, and GPU-Z once led the field in GPU diagnostics — but their architectures haven’t kept pace with how GPUs are used today. In a world driven by real-time rendering, AI computing, and cross-platform workflows, older tools often fall short.
The Problem with Legacy Tools
1. Static Testing
Legacy platforms typically offer a single, fixed “score” after a short run. They don’t reveal how performance changes over time or under sustained load.
2. Unrealistic Load Simulation
FurMark’s heat-intensive test isn’t representative of gaming, rendering, or AI tasks. Meanwhile, UserBenchmark doesn’t simulate any load at all.
3. Installation Roadblocks
Most tools require downloads, admin rights, and Windows-only environments — restricting their use in educational, enterprise, or mobile workflows.
4. No Reporting or Collaboration Support
There’s no native export or reporting system. Users must rely on screenshots, spreadsheets, or community comparisons that lack context or detail.
5. Bias and Inconsistency
Platforms like UserBenchmark have received criticism for unfair weighting algorithms and brand bias, leading to inaccurate or gamified results.
Side-by-Side Comparison: Legacy vs TestMySpec.com
| Feature | Legacy Tools (UserBenchmark, FurMark) | TestMySpec.com |
|---|---|---|
| Real-time monitoring | ❌ No | ✅ Yes — FPS, thermals, power, latency |
| Stress/load simulation | ❌ Limited or artificial | ✅ Stress Zone with sustained workloads |
| Cross-device compatibility | ❌ Desktop-only | ✅ Browser-native, all OS/devices |
| PDF performance report | ❌ Not supported | ✅ One-click, visual PDF export |
| Installation required | ✅ Yes | ❌ None — fully web-based |
| Requires admin privileges | ✅ Usually | ❌ No elevated access needed |
| Exportable performance data | ❌ No | ✅ High-resolution graphs included |
| Mobile/Chromebook testing | ❌ Unsupported | ✅ Full support for iOS, Android, ChromeOS |
| Privacy and data control | ❌ Often sends data externally | ✅ Runs locally — no uploads or tracking |
Why It Matters in 2025
GPUs are now essential not just for gamers, but for:
- AI inference pipelines
- WebGL/WebGPU rendering
- Remote workstations and mobile editing
- Enterprise graphics and thin clients
Tools must adapt to these scenarios. TestMySpec.com offers a streamlined, secure, and universally compatible alternative that meets the needs of today’s GPU-powered workflows.
Use Cases by Persona
Whether you’re tuning frames in a competitive shooter or validating GPU behavior across a device fleet, TestMySpec.com provides practical, real-time insight for your needs.
Gamers
Needs:
- Optimize frame rates
- Detect stuttering or thermal throttling
- Confirm boost behavior under load
How TestMySpec.com Helps:
- Run a test before and after overclocking or applying new settings
- Watch FPS and frame time stability in real-time
- Use Stress Zone to simulate extended gaming sessions and validate thermal performance
Real Scenario:
A gamer notices frame dips after switching to a new case. TestMySpec.com reveals consistent thermal buildup after 8 minutes — suggesting airflow optimization is needed.
Developers & Studios
Needs:
- Validate graphical engine changes
- Confirm stable rendering performance
- Monitor behavior across OS and hardware targets
How TestMySpec.com Helps:
- Load new builds and test frame time, temperature, and power under Stress Zone
- Export PDF logs for team reviews or release validation
- Run browser-based tests across QA hardware stacks — no installation needed
Real Scenario:
After an engine update, a team sees user complaints about GPU stutter. Testing on TestMySpec.com reveals thermal throttling caused by an unoptimized lighting system in new levels.
AI Researchers & ML Engineers
Needs:
- Validate GPU behavior during inference or fine-tuning
- Ensure stable thermal performance over time
- Test mobile or edge devices without installing native tools
How TestMySpec.com Helps:
- Simulate high-load behavior with Stress Zone
- Observe power draw, clock speed stability, and thermal buildup in real time
- Generate visual reports for internal research documentation
Real Scenario:
A researcher validating inference on an M1 MacBook Air runs a 15-minute Stress Zone session. The report shows thermals stabilize at 85°C without CPU co-throttling — confirming the configuration is viable.
PC Builders & System Integrators
Needs:
- Validate thermals, clock behavior, and stability on new builds
- Certify systems before delivery
- Provide proof of performance to customers
How TestMySpec.com Helps:
- Run post-build tests with Stress Zone
- Export PDF reports as delivery documentation
- Ensure each build passes standard thermal and FPS thresholds
Real Scenario:
A boutique builder includes TestMySpec PDF reports with every system sold — showing the end-user verified temps, FPS, and clock behavior without requiring additional setup.
QA Teams & IT Admins
Needs:
- Test systems without remote access or installs
- Compare performance across device batches
- Document performance degradation or bottlenecks
How TestMySpec.com Helps:
- Share a test link to remote users — no installs, no permissions needed
- Receive back PDF reports showing detailed, timestamped diagnostics
- Archive reports for internal tracking or support documentation
Real Scenario:
A corporate IT admin distributes a benchmark link to 50 employee laptops. Within a day, the team collects all performance results — neatly formatted and ready for evaluation.
100% Free — No Sign-Up, No Subscription

TestMySpec.com is completely free to use. There are no downloads, no paywalls, and no sign-ups required. Whether you’re benchmarking a gaming PC, diagnosing a mobile device, or validating hardware across multiple systems, you can access all features — including real-time metrics, stress testing, and PDF report export — at no cost.
Works on Every Device — Including Mobile
Unlike traditional benchmarking tools, TestMySpec.com is built to run seamlessly on any device with a modern browser — no installation, no setup, no compromises.
Whether you’re using:
- A Windows desktop with a dedicated GPU
- A macOS laptop with integrated graphics
- A Chromebook in a classroom or enterprise setting
- An Android or iOS phone for mobile gaming or development
- A tablet or thin client in a remote workflow
TestMySpec.com works out of the box.
All testing is done in-browser using WebGL/WebGPU, making it ideal for:
- Mobile game developers validating performance under load
- QA testers working across a fleet of mixed hardware
- Gamers who want to benchmark phone thermals and FPS without rooting or sideloading
- IT admins performing diagnostics on locked-down or BYOD devices
No matter the platform, you get the same real-time metrics, interactive stress testing, and clean PDF reporting — all from a single browser link.
Conclusion: The Future of GPU Testing Is Real-Time, Cross-Device, and Code-Free
The demands on GPUs today are broader, more intense, and more diversified than ever before — from immersive gaming and 3D rendering to machine learning inference and browser-native compute tasks. Yet legacy benchmarking tools remain stuck in the past: static scores, platform lock-in, and unrealistic testing models.
In contrast, TestMySpec.com introduces a new paradigm for GPU performance analysis:
- Real-time monitoring of critical performance metrics like FPS, latency, thermals, and power draw
- Stress Zone simulations that replicate sustained workloads for gaming, rendering, and AI
- Zero setup required — no installation, no drivers, no OS limitations
- Cross-device compatibility, running on everything from high-end desktops to Chromebooks and mobile devices
- PDF report generation, enabling clear, timestamped documentation and performance validation
Whether you’re a gamer optimizing competitive frame rates, a developer debugging rendering pipelines, or an IT professional validating device fleets, TestMySpec.com delivers transparent, actionable insights without the bloat or friction of traditional tools.
Why TestMySpec.com Changes the Game
Unlike older solutions, TestMySpec.com isn’t trying to gamify your hardware. It’s built for real-world performance transparency — to help you understand not just if your GPU works, but how it performs under the conditions that matter to you.
In summary:
- No downloads
- No accounts
- No data collection
- No synthetic guesswork
Just open the browser, run the test, and get your results — clearly, securely, and instantly.
What You Can Do Next
- Benchmark your system right now: Visit TestMySpec.com and start a test — no install, no setup.
- Run the Stress Zone: See how your GPU performs under sustained load in real-world conditions.
- Export your report: Save your session as a clean PDF for sharing or documentation.
In a world where workloads are changing and mobility is the norm, the future of GPU testing belongs to tools that are flexible, real-time, and user-first. That future is already here — and it starts at TestMySpec.com.